Multiple Y Axis
XMap3 v.3.0.3.11
When the XMAP software is communicating with an XEDE via the comms cable each map will show, at the top of the map display, an RPM and load value (x and y axis for the map) in real time.
WaveGradient v.1.0
WaveGradient is a small utility to view the properties of wave files. This time three properties of a wave are represented: time (on the X-Axis), location (on the Y-axis) and amplitude (encoded in alphavalues).
Calculus Grapher v.2.03
Create function graphs with the help of this tool. Calculus Grapher draw a graph of any function and see graphs of its derivative and integral. Don't forget to use the magnify/demagnify controls on the y-axis to adjust the scale.Non-obvious controls:
CHT - Cartesian HTML Table v.2.0
A JavaScript component that allows an ordinary HTML table to be visually browsed both in the 'X' and 'Y' axis, as a Cartesian Coordinate System.
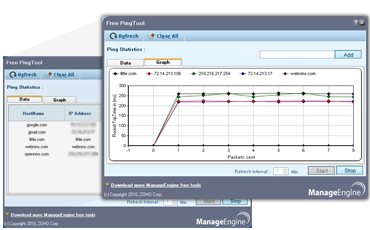
ManageEngine Free Ping Tool v.1.0
The ManageEngine FREE Ping tool is a simple yet powerful tool with an elegant UI that helps to issue ping requests to "Multiple IP Addresses" in a single instance.
Free Ping Tool v.1.0
Monitors multiple servers at a instance with values shown in a graph. Free Ping Tool is an advanced and reliable software designed to issue ping requests to "Multiple IP Addresses" in a single instance.
Infrared Reader v.1.0
The spectrum may be expanded to see a portion of the data in greater detail. Also, there is provision for reversing the X-axis. Finally, note the capability to mark the peak frequencies.
Imgki v.1.5.5
Estimate influx constant fast and easy. imgki help you with the estimation of influx constant (Ki) from dynamic PET images in ECAT 6.3 or 7.
Bronkhorst FlowPlot v.3 28
Bronkhorst FlowPlot is a software tool for monitoring and optimising digital instruments parameters. FlowPlot is a DDE client program for service purposes on Bronkhorst digital instruments or readout units.
Plot Digitizer v.2. 4. 2001
Plot Digitizer is a great piece of software developed by Joseph A. Huwaldt. The main goal of the program is to extract information from two-dimensional plots or graphs.
Climogram v.1.0.0
Climogram is a classic form of representation of the climate, what allows in a simple way, the comparison of the climatic variation between two or more areas.